May 2023 – Hamilton Real Estate ON.
HERE’S WHAT HAPPENED THIS MONTH!
May 2023 Sales are up 2.7% since a year ago. New listings are still lower than last year at this time, by 21.1%. Average prices continued to decrease since the peak in February of 2022, dropping 10.4% from where they were a year ago in May. The current inventory levels throughout the REALTOR® Association of Hamilton-Burlington (RAHB) market area are now lower than reported last year. The lower than normal inventory levels have pushed homes upwards again in most area of Hamilton-Burlington. May 2023 had 2031 total Residential Listings come through the Hamilton Real Estate Board as reported by The Realtors ® Association of Hamilton-Burlington (RAHB). Hamilton had 1234 of those (down 24.8% from 2022) and Burlington’s share was 429, down 20.7% from May last year. Overall New Listings have increased by 32% since last month and have decreased 21.1% over May 2022.
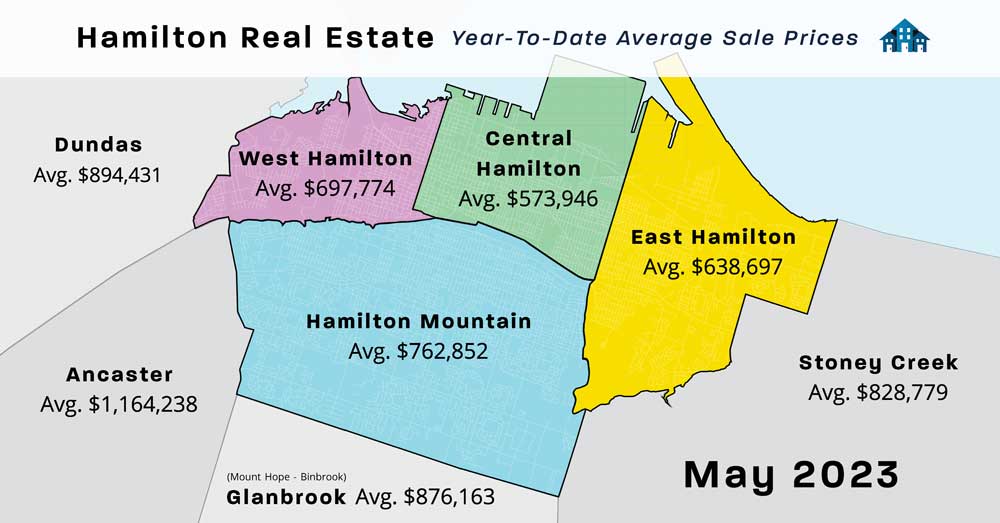
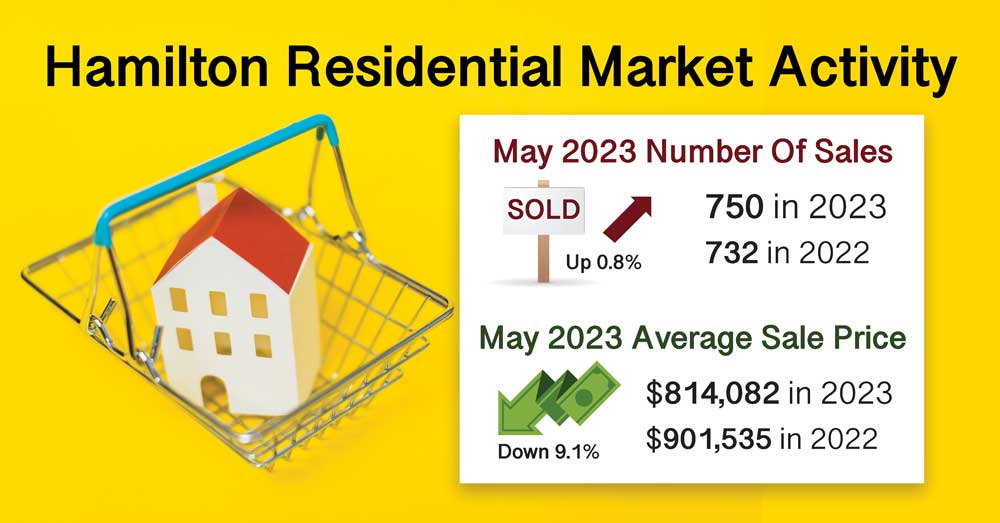
Residential Sales located throughout the RAHB market area (including Burlington and all the outlying areas covered by The REALTORS® Association of Hamilton-Burlington) of 1254 Properties are up 2.7% from May 2022, and are also up 12% over last month, April 2023. The overall average price for residential properties decreased slightly from last month ($888,773) to $884,083, which is down 10.4% from last year at this time. Hamilton’s Residential Sales (including Flamborough, Dundas, Ancaster, Waterdown, Stoney Creek and Glanbrook) were 750 down 0.8% from May 2022, with an average price of $814,082 down 9.1% from the same month last year, however, done up since last month which was $806,809. Burlington had 314 Sales which is up 6.4% from last year, with an average price of $1,127,635 which is down 7.9% from May 2022, and has decreased slightly over last month’s average of $1,144,424.
The end-of-month listing inventory which is a good indication of the type of market currently being experienced now sits at 1114 Active Residential Listings giving Hamilton 1.5 months of supply, which is up 16.1% over May 2022, and up from last month. Burlington is also slightly higher than last month and now has 291, Active Residential Listings which gives it just under 1 month of supply down 25.4% from the same time last year. Overall, the number of Active Listings Available at the end of the month now sits at 1830 properties for sale, which is 1.47 months supply, compared to 2103 and 1.72 months of supply in May 2022, up month over month from 1710 and 1.6 months supply in April 2023. The average days on the market also shows more than last year, however overall taking less time than last month to sell a home. It went from 12 to 19 days in Hamilton year over year and in Burlington 12 to 17 days.
The Hamilton-Burlington Area has maintained its Sellers Market Status from last month, where the ratio of homes Sold to Homes Listed is over 60%, currently sitting at the 62% (6.2 homes sold for every 10 listed). Important Note: If you are currently looking for a property, ask your REALTOR® to show you the history of any property you are interested in. This will give you valuable information about how long the property has actually been for sale, and when/if the price was adjusted and possibly how much it sold for previously!
|
Buyers Market
Below 40%
|
Balanced Market
Between 40% and 60%
|
Sellers Market
Above 60%
|
|
(Ratio of Homes Sold to Homes Listed)
|
||


