
March 2019 Hamilton Real Estate Statistics of Solds
March 2019 had 1108 Residential MLS Listings come through the Hamilton Real Estate Board. This is 4% HIGHER than March 2018 as reported by The REALTORS ® Association of Hamilton-Burlington (RAHB). Burlington is DOWN 7% with just 430 New Listings.
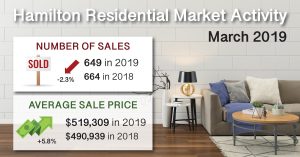
Residential Sales located throughout the RAHB market area (including Burlington and all outlying areas covered by RAHB) of 1032 Properties were down this month again, a 1.2% drop from the same month last year, however, went up 40% over February 2019! Residential Sales in Hamilton (which includes Hamilton plus Flamborough, Dundas, Ancaster, Waterdown, Stoney Creek and Glanbrook) were 649of that total. The Average Hamilton Residential Sales Price of properties sold through the RAHB Multiple Listing Service® (MLS) system in March 2019 was $519,309 up 6% from $490,939 the same month last year. Burlington’s average Residential Price at $738,839 is up only very slightly from $738,015 last year. The end of month listing inventory shows 1383 Active Residential Listings, giving Hamilton 2.1 months of inventory, which is up 50% compared to 921 Properties still available for sale at the end of March last year which was 1.4 months of inventory. Burlington has 1.9 months of inventory (up15%) with 500 active listings for sale. Average days on the market increased from 26 to 31.2 this year for Hamilton and also increasedin Burlington from 21.8 to 26.6.
The Hamilton – Burlington Area has slipped slightly from last month from a Sellers Market to the top end of a Balanced Market, where the ratio of Homes Sold to Homes Listed is between 40% and 60%, currently sitting at 59.2% for Residential, (in other words, 6 homes are sold for every 10 new listings). Homes Sold to Homes Listed Ratio: Buyers Market is below 40%, Balanced Market is between 40-60%, and Sellers Market is above 60%.
For the rest of the article Click Here
